
Mermaid+GPT From Requirements to Flowchart
Published:
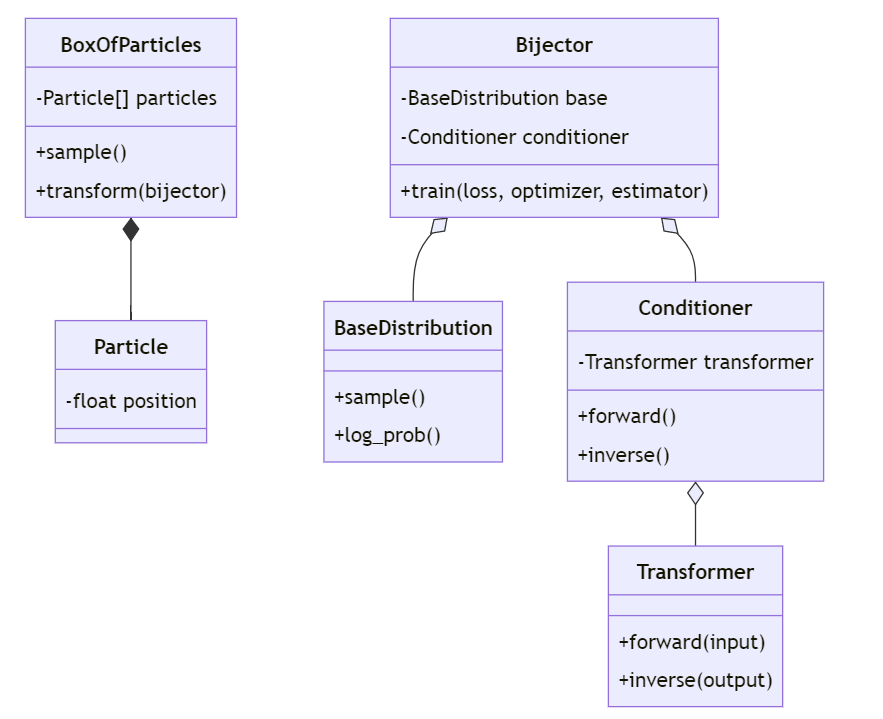
本文将介绍如何将程序需求自动变成容易修改的流程图,使用的工具是Copilot和Markdown,下面是我得到的结果:
我提出的prompt是:
Given the following requirements, create mermaid diagram code that shows the relationship, use classDiagram and others in mermaid. Requirments: [Discription of the needOmmited for brevity]
以下是原文
Mermaid的使用非常简单,在你喜欢的markdown浏览器插件里搜索Mermaid安装即可(许多编辑器都内置了这个,无需安装),能够做到Markdown的所见即所得,无需LaTeX复杂的语法和Exhaustive的配置、编译。
Mermaid is a JavaScript library that allows you to create diagrams in Markdown. It is based on the Graphviz library, which is a graph visualization tool.
Why Mermaid?
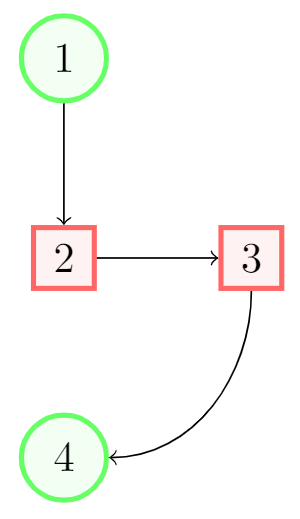
In LaTeX, we can create diagrams using the TikZ package. But the syntax is not very intuitive and it is not easy to create complex diagrams.
\documentclass{article}
\usepackage{tikz}
\usetikzlibrary{positioning}
\begin{document}
\begin{tikzpicture}[
roundnode/.style={circle, draw=green!60, fill=green!5, very thick, minimum size=7mm},
squarednode/.style={rectangle, draw=red!60, fill=red!5, very thick, minimum size=5mm},
]
%Nodes
\node[squarednode]      (maintopic)                              {2};
\node[roundnode]        (uppercircle)       [above=of maintopic] {1};
\node[squarednode]      (rightsquare)       [right=of maintopic] {3};
\node[roundnode]        (lowercircle)       [below=of maintopic] {4};

%Lines
\draw[->] (uppercircle.south) -- (maintopic.north);
\draw[->] (maintopic.east) -- (rightsquare.west);
\draw[->] (rightsquare.south) .. controls +(down:7mm) and +(right:7mm) .. (lowercircle.east);
\end{tikzpicture}
\end{document}
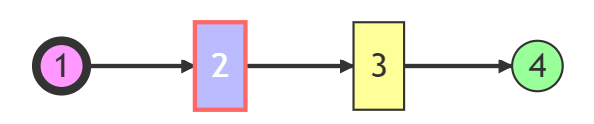
Using Mermaid, we can create the same diagram in Markdown:
graph LR
    A((1)) --> B[2]
    B --> C[3]
    C --> D((4))
    style A fill:#f9f,stroke:#333,stroke-width:4px
    style B fill:#bbf,stroke:#f66,stroke-width:2px,color:#fff
    style C fill:#ff9,stroke:#333
    style D fill:#9f9,stroke:#333
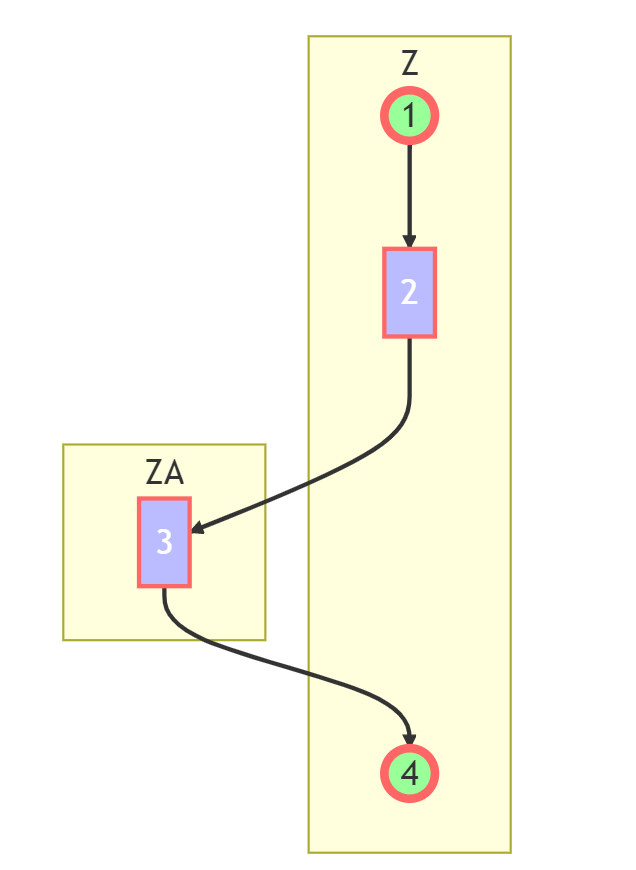
 Now if we want to keep 1, 2, 4 in one line and move 3 to the right, and also connect (1,2), (2,3), (3,4), we can use the
 subgraph keyword:
graph TB
    subgraph Z
        direction TB
        A((1)) --> B[2]
        D((4))
    end
    subgraph ZA
        direction RL
        C[3]
    end
    B-->C
    C-->D
    style A fill:#9f9,stroke:#f66,stroke-width:4px
    style B fill:#bbf,stroke:#f66,stroke-width:2px,color:#fff
    style C fill:#bbf,stroke:#f66,stroke-width:2px,color:#fff
    style D fill:#9f9,stroke:#f66,stroke-width:4px
Use Case: Function Signature Design Diagram
Say if I have some functions with params:type and return type, I can use Mermaid to create a diagram to show the relationship between them. We can use the classDiagram to create a more complex diagram:
classDiagram
    class A{
        +int x
        +int y
        +void foo()
    }
    class B{
        +int x
        +int y
        +void foo()
    }
    class C{
        +int x
        +int y
        +void foo()
    }
    A <|-- B
    A <|-- C
    B <|-- C
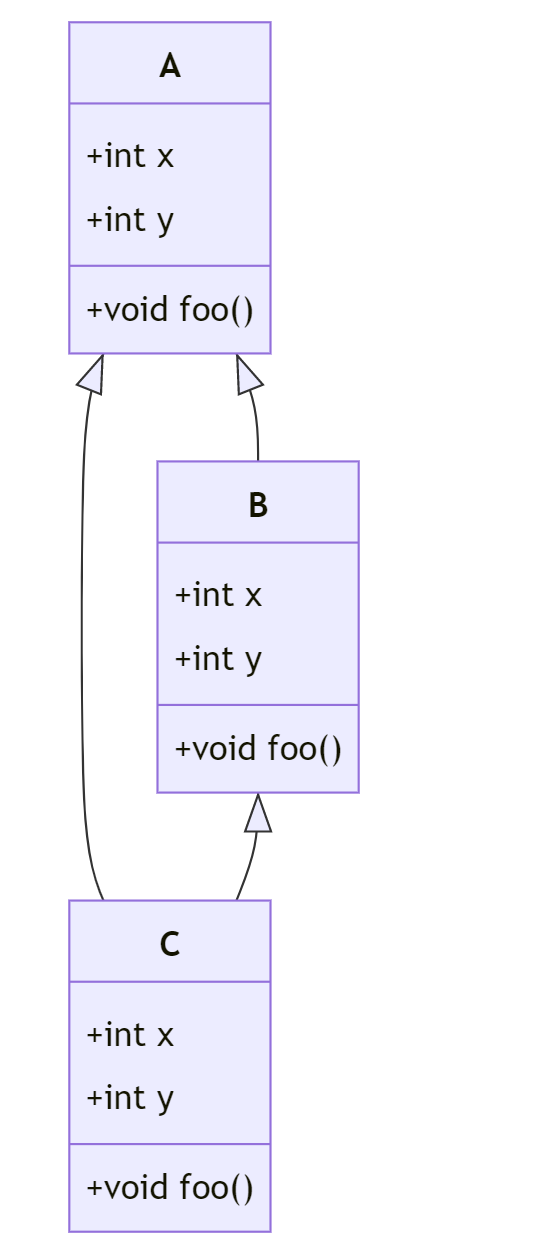
This would be quite helpful when we are designing an app or trying to figure out the relationship between different classes.
Given the following requirements:
A python class that simulate a box of particles, with their position
recorded.
It supports sampling, transforming the distribution of the particles.
The sampling is related to the particle model, the transforming is
related to the bijector model.
Given a bijector, we can train it to yield the final result.
The training process is related to the loss function, the optimizer
and the estimator.
the bijector model takes the base distribution as input, to make it
scalable, only the conditioner is trained. The conditioner is a transformer.
Transformer accepts arbitrary input and have constant difficulty.
Create mermaid diagram code that shows the relationship, use classDiagram and others in mermaid
classDiagram
    class BoxOfParticles{
        -Particle[] particles
        +sample()
        +transform(bijector)
    }
    class Particle{
        -float position
    }
    class Bijector{
        -BaseDistribution base
        -Conditioner conditioner
        +train(loss, optimizer, estimator)
    }
    class BaseDistribution{
        +sample()
        +log_prob()
    }
    class Conditioner{
        -Transformer transformer
        +forward()
        +inverse()
    }
    class Transformer{
        +forward(input)
        +inverse(output)
    }
    BoxOfParticles *-- Particle
    Bijector o-- BaseDistribution
    Bijector o-- Conditioner
    Conditioner o-- Transformer
This code is in fact generated by GPT Given the requirments above. And it’s QUITE accurate.
文章中英混杂,懒得改了,下次再说。